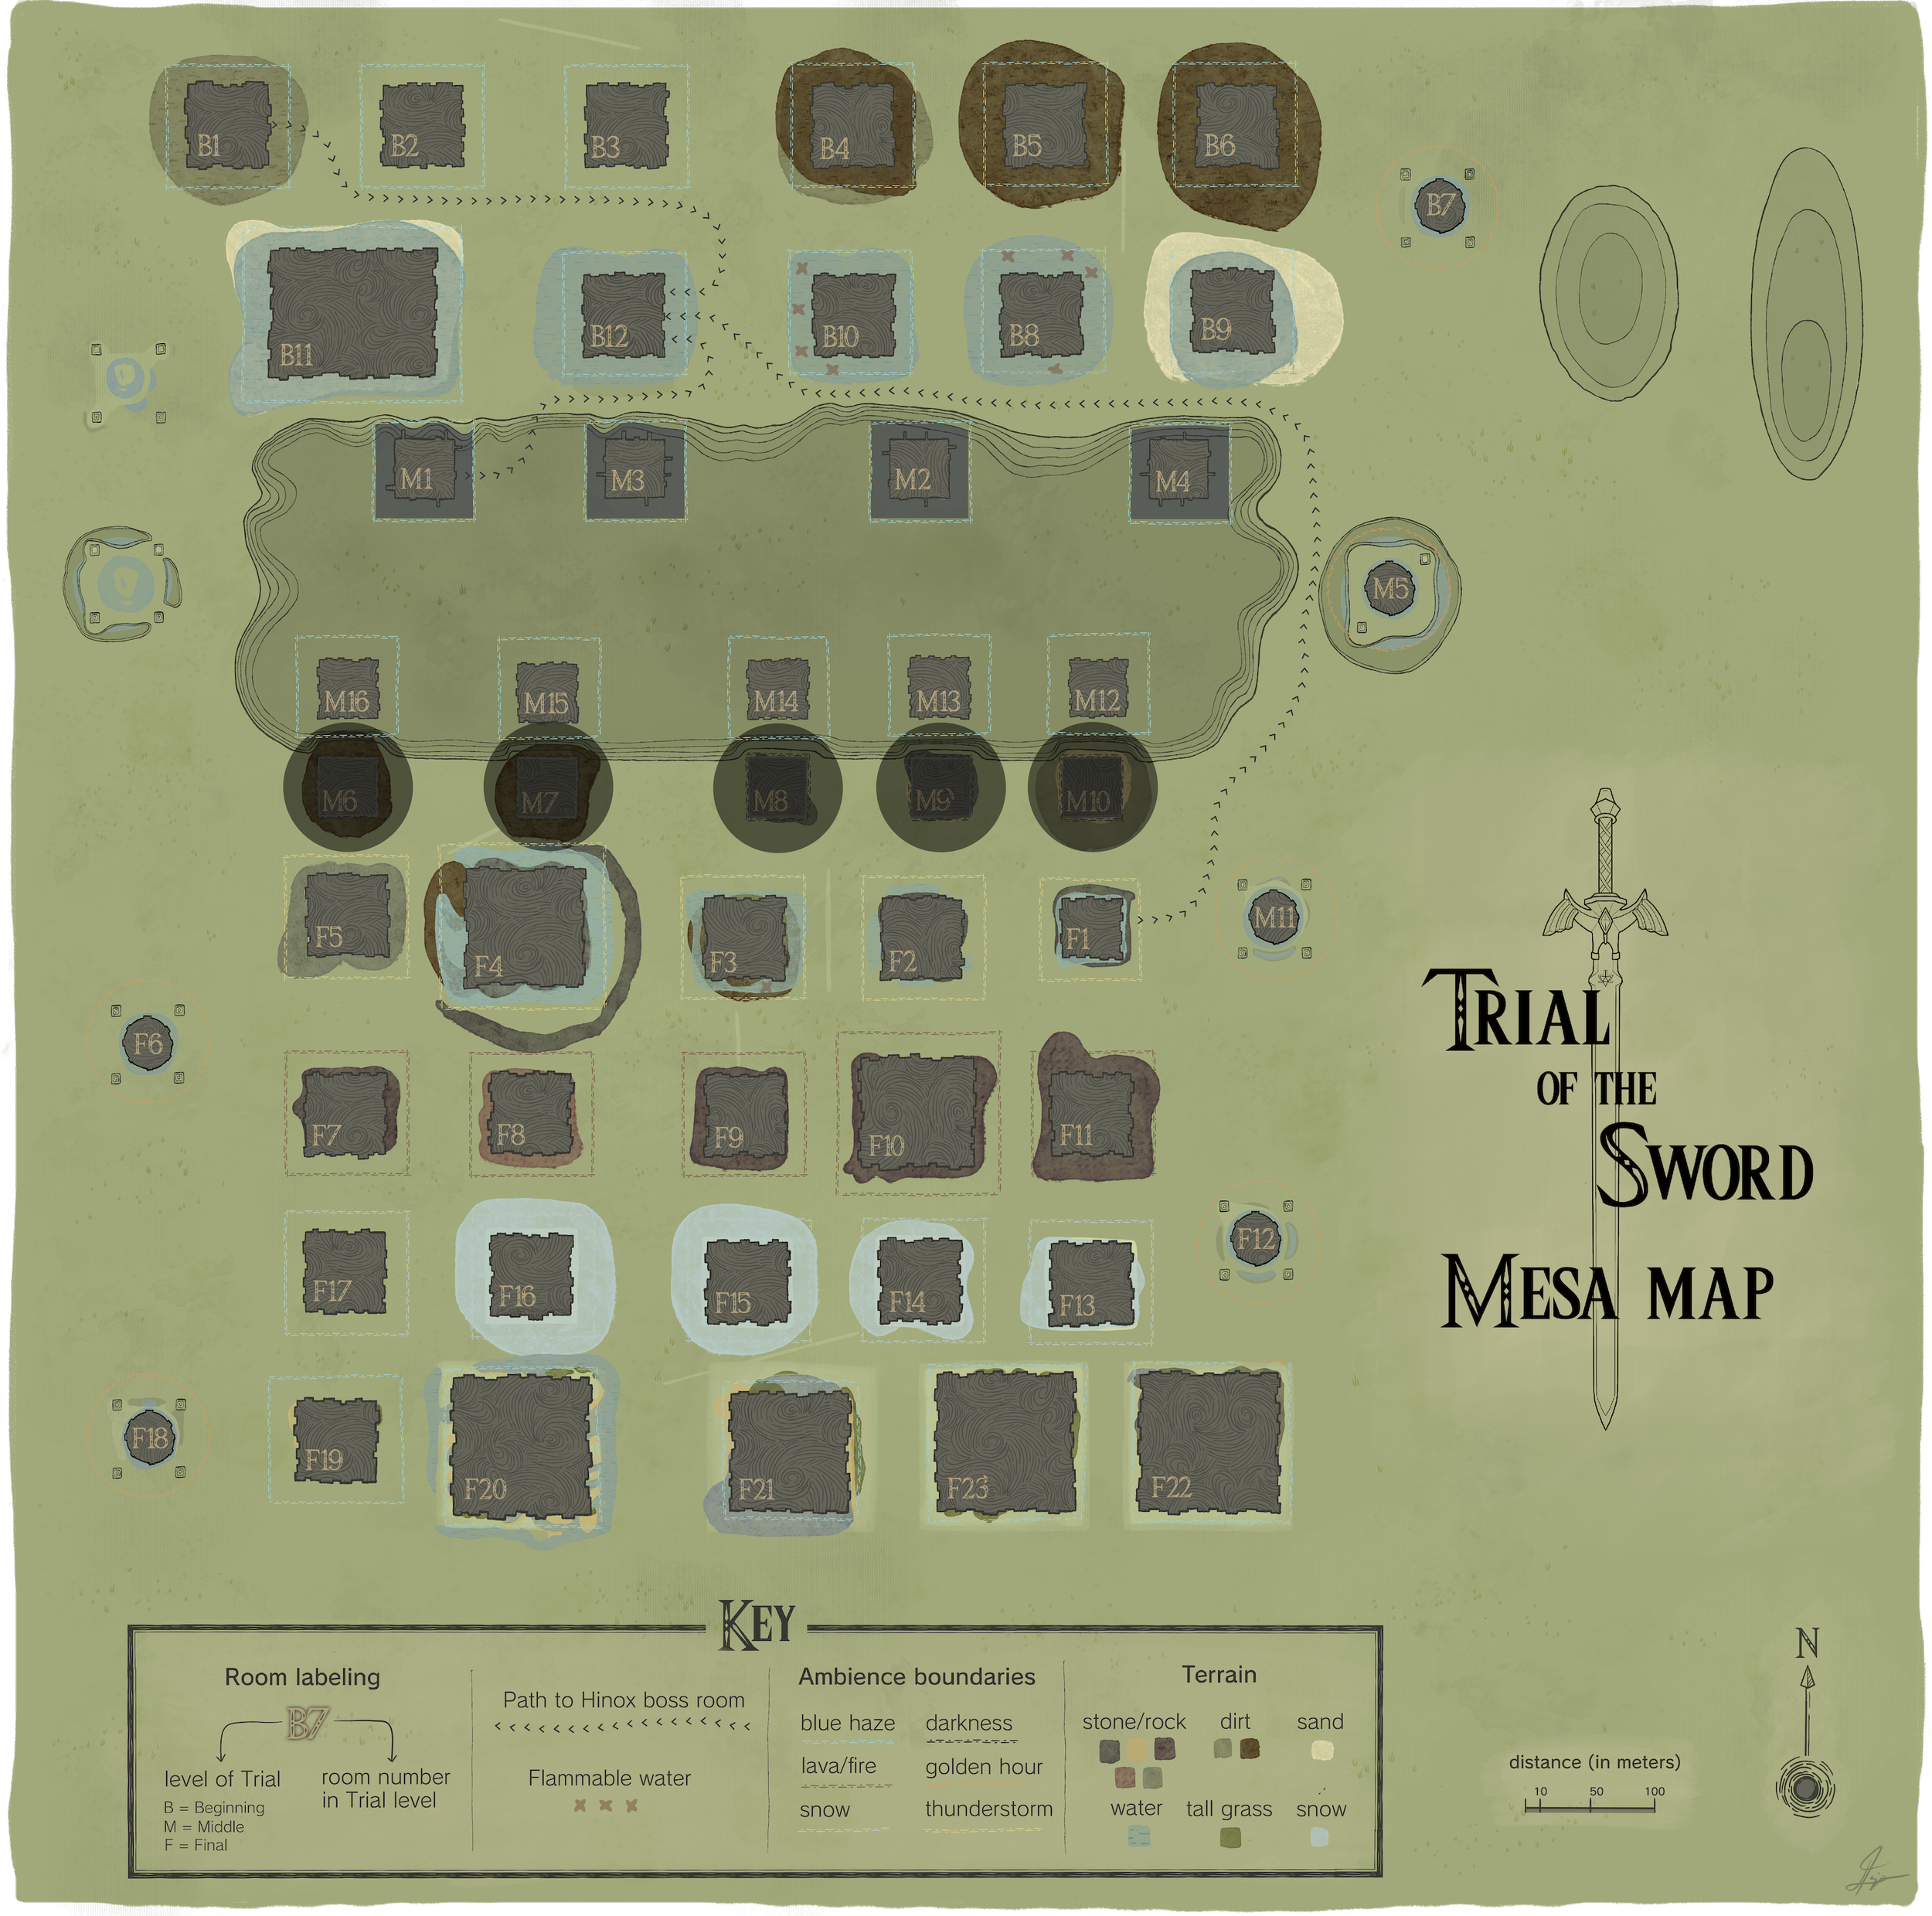
Maps & Charts
Black Death Dispersions, 1200-1500
The Medieval Academy of America
This draft shows the spread of plague (Yersinia pestis) through Eurasia and Africa. It was commissioned by the Medieval Academy of America for their webinar, “The Mother of All Pandemics: The State of Black Death Research in the Era of Covid-19” (May 15th, 2020).
The Legacy of Chicago’s Shifting Ethnic Spaces, 1840-2000
The Committee on Geographical Sciences | University of Chicago
The ethnic zones shown represent only the major “core” areas of dense residence of major groups. They do not depict the boundaries of a groups’ actual distribution; only approximate outlines.
Arrows suggest generalized movement of these core areas. Darker and lighter colors represent older and newer concentrations, respectively.
Ethnic shifts ending before 2000 do not imply a group’s demise, only the loss of their spacial concentration in those locations within Chicago.
*Note: this is a skeleton of the completed map. The final labels, key, and other annotations are not included.
Map of Cornucopia
Interpreted from “The Ickabog” by J.K. Rowling
Trial of the Sword Mesa Map
Ibiza 2023 Narrative Chart
Any personal identifiers have been anonymized.
High School Axial Dating Map
Axial maps show connectivity of roads with color, typically to illustrate a city’s ease of travel. The result is the map of an urban network in a series of shifting hues.
In this map, the same principles were applied to my high school’s dating scene, where each couple is an intersection.
(All names have been changed)